Find the next neighbourhood before it is the next neighbourhood.
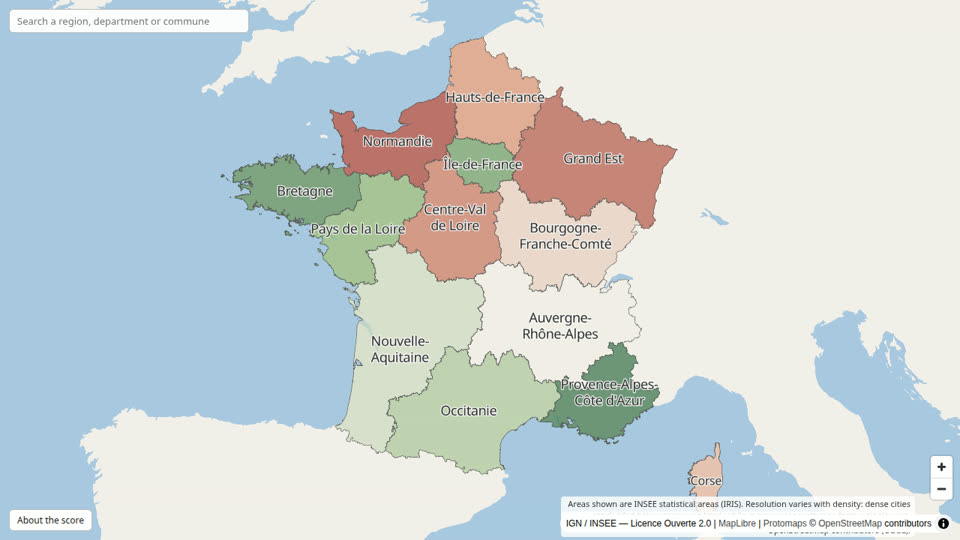
MapYield gives one score, from 0 to 100, to every region, city and street block in France and the USA. It says where a place is heading, not just where it is, so you can see a rising area before the prices show it.
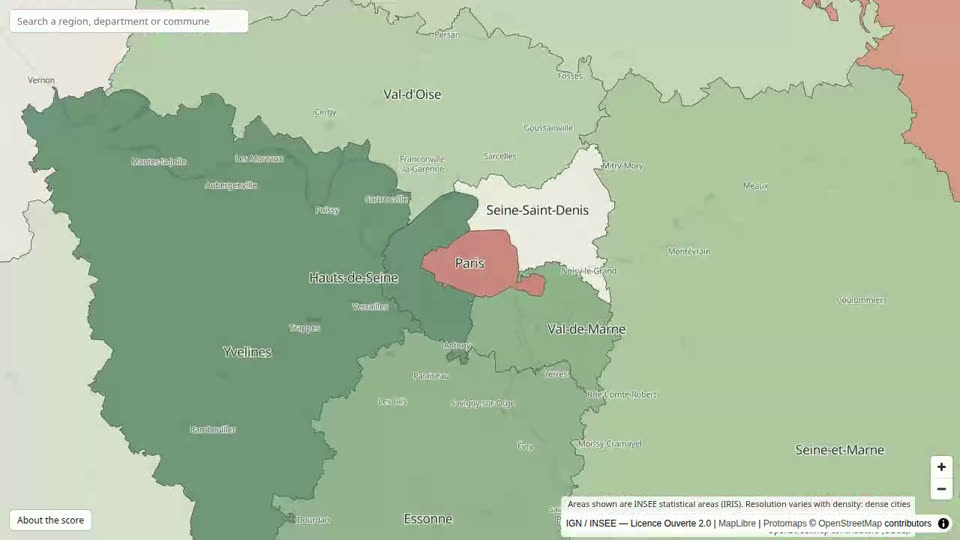
Zoom in and the map keeps answering.
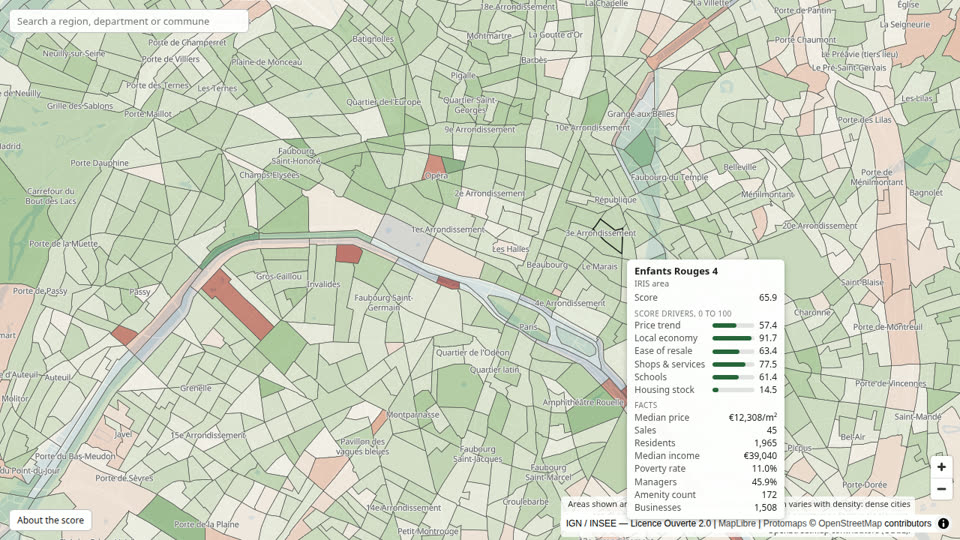
The same score is computed at every level, so a region, the city inside it and one block of that city can each be compared with their peers. Hover any area to read its score and the numbers behind it.
What the score is made of.
A weighted sum of eight subscores, each ranked 0 to 100 against the rest of the country, built from public data: property sales, building permits, business registers, census, police and hazard records. Shares below are France's; the USA model uses six of the same pillars. The "About the score" button on each map lists them.
- Price trend
- Where the area is heading: price per m², building permits, businesses opening and closing, and how many people moved in recently.
- Local economy
- How well off the area is: managers' share of jobs, poverty, income and its trend, businesses per resident.
- Ease of resale
- How easily a home here sells on: sales per home, and whether they are rising.
- Shops & services
- Shops, health care, transport, sport and culture, per resident.
- Safety
- Whether burglary, violence and theft are falling or rising. The trend, never the level.
- Housing stock
- Empty homes and whether their share is falling, and how many homes are owner-occupied.
- Hazard safety
- How little natural hazard the area faces. Higher means safer.
- Schools
- Schools and higher education in the area, per resident.
Made for people who choose a place with money on the line.
Property investors
Compare a hundred neighbourhoods in an afternoon. A high price trend with a still-low price is the block to visit first, and the readout gives you the price per m², the sales volume and the income to check it against.
Business owners
Pick a location by who lives around it and where they are heading: income, managers' share, businesses opening or closing, how many people moved in. Then find the same profile in a city you do not know.
Home buyers
Know what a street is like before you visit: safety trend, schools, shops, empty homes, hazards. The score is one number, and every number behind it is on the map.
The country is free. Zoom-in for €5 a month.
-
Regions and statesFree
Every region of France and every US state, scored and hoverable. No account.
-
Everything below€5 / month, VAT included
Departments, communes and IRIS neighbourhoods in France. Counties, census tracts and block groups in the USA. Cancel any time.
We are constantly adding new features and countries, tell us where we should go next.
A country, a data source, a number you wish the readout had. Every request lands in our inbox and is read by a person. Or write to contact@mapyield.com.